Making a word-cloud for a topic on Twitter using R
This post continues with my new found love for R and Twitter mining. What we'll be trying to do here is analyse tweets and make a graphical word cloud to find out what people are talking about, about a particular topic.
To get started with R and the new Twitter API 1.1, please check this previous post.
Once you're done with the authentication and stuff, let's chew on some tweets.
For this experiment I chose the ever-in-the-news City of Joy, where I hail from - viz Calcutta. Like in the past, we use the TweetFrame function to get our data frame of latest tweets.
Apologies again for shoddy screenshots, but Blogger's text editor is retarded. Also, I'll make a permanent solution to it soon, by using some CSS here and there. Till then, please make do with this.

Next, we'll extract the text part from these tweets and do some pre-processing. To do string processing, R provides a handy package called stringr. So just click on Tools > Install Packages and do the needful. Remember to "check" the package in the "package" tab next to the console on the right.
Here we'll be using some regular expressions to match patterns with unwanted portions of the tweet like double spaces ( " "), the retweet header ( RT @SoAndSo), shortened URLs ( http://t.co/8characterCombinationsOfLettersAndNumbers ), hashtags ( #likethis) and random Twitter handles ( @ofThisType ), and then we'll replace these matched patterns with "" or nothing - thus effectively removing these unwanted elements. The str_replace_all function comes in the stringr package and is quite self explanatory. str_replace_all(text, "this", "that") replaces all occurrences of "this" in text with "that".

Now for the next, and the last bit, we'll need another package called tm. tm stands for Text mining, and in essence, this is exactly what we're doing here. So install tm like you just installed stringr and then proceed.
We now use nest these two functions from the tm package called VectorSource and Corpus. What we're doing here is simply forcing the cleanText into a new type of data structure or Class called Corpus. Now we process our nascent corpus.
We use this nicely available tm_map function to convert this corpus to lower case, then remove punctuation, and then do some weird thing called stopwords. You pass the corpus text and what you intend to do with it, as parameters to the tm_map function. (Look at the screenshot, and you'll understand.)
Now you're probably wondering this stopwords does. What it does is merely a dictionary lookup for the language that you've specified ('english') and then removes all commonly occurring words like "and", "is" "or" etc. So that we can focus more on the key words and not these prepositions and conjunctions which always occur in plenty.
Note that you might get warnings during any of the steps in this stage, but they're mostly owing to inconsistency in the tweets, and is not a big problem. Remember that you can ignore warnings, but you need to debug your code if you get an error message. When I tried with 500 tweets, I got an error message saying there's some discrepancy in tweet length. Using a smaller sample of tweets, though not advised, is the only way to get past such a roadblock.

Next, we make a Term Document Matrix with the processed tweetCorpus using the ... umm.. TermDocumentMatrix function. This is one helluva function that integrates all your data into a nice understandable format. You might get a warning again, like the one in the screenshot, but worry not.
With this TDM, we now coerce it into a matrix format with the as.matrix function. Once this is done, click on tdMatrix in your workplace (where you have the list of variables), and you'll see how beautifully organised the whole matrix is. You'll notice that it's a sparse matrix with mostly 0s in its cells. A 1 or a 2 in a cell means that that particular term (corresponding to the row of the matrix) occurs once or twice in the tweet corresponding to the column number. It is thus, essentially a term-frequency matrix. Also you can type tweetTDM in the console to see some facts about your tweet document matrix - number of 0s, how sparse the matrix is and so on.
With the last function in this screenshot, we do two things. One, sum each row to get the frequency of each term in ALL tweets combined, and then sort this matrix in decreasing order of frequency.

Now all that is left is to use two more nice functions to plot the cool word cloud. Plug in the following two bits of code, the first of which defines how the cloud is to be formed and the next, which actually displays the cloud :

And presto! You'll see your cloud to the right of your console, under the "plot" tab.
For me, it looked like this:
 A rather grim picture this word-cloud paints. You can see words like "rape", "scam", "kill", "murder" occurring with a moderately high frequency. Also, "park" and "street" could only mean "park street". Moreover, stuff like "west bengal", "mamata" and "cpm" verify the correctness of the experiment.
Repeating the same steps for Mumbai gave the following, more cheerful result.
 For Bangalore, it was a disaster. The API couldn't retrieve more than 99 tweets, and the result is pretty random.
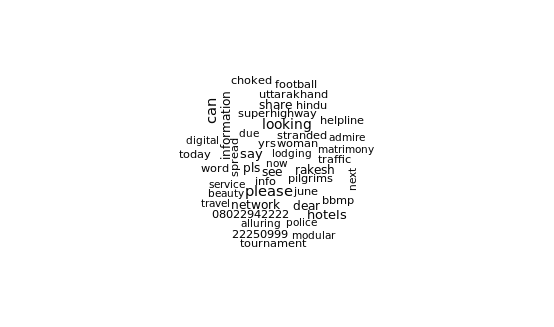
 Lastly, I tried with Delhi. The result was quite inconclusive, with not many prominent trends, except for "police".

 |
| Caution : It won't be as fancy as this though. |
Once you're done with the authentication and stuff, let's chew on some tweets.
For this experiment I chose the ever-in-the-news City of Joy, where I hail from - viz Calcutta. Like in the past, we use the TweetFrame function to get our data frame of latest tweets.
Apologies again for shoddy screenshots, but Blogger's text editor is retarded. Also, I'll make a permanent solution to it soon, by using some CSS here and there. Till then, please make do with this.
Next, we'll extract the text part from these tweets and do some pre-processing. To do string processing, R provides a handy package called stringr. So just click on Tools > Install Packages and do the needful. Remember to "check" the package in the "package" tab next to the console on the right.
Here we'll be using some regular expressions to match patterns with unwanted portions of the tweet like double spaces ( " "), the retweet header ( RT @SoAndSo), shortened URLs ( http://t.co/8characterCombinationsOfLettersAndNumbers ), hashtags ( #likethis) and random Twitter handles ( @ofThisType ), and then we'll replace these matched patterns with "" or nothing - thus effectively removing these unwanted elements. The str_replace_all function comes in the stringr package and is quite self explanatory. str_replace_all(text, "this", "that") replaces all occurrences of "this" in text with "that".

Now for the next, and the last bit, we'll need another package called tm. tm stands for Text mining, and in essence, this is exactly what we're doing here. So install tm like you just installed stringr and then proceed.
We now use nest these two functions from the tm package called VectorSource and Corpus. What we're doing here is simply forcing the cleanText into a new type of data structure or Class called Corpus. Now we process our nascent corpus.
We use this nicely available tm_map function to convert this corpus to lower case, then remove punctuation, and then do some weird thing called stopwords. You pass the corpus text and what you intend to do with it, as parameters to the tm_map function. (Look at the screenshot, and you'll understand.)
Now you're probably wondering this stopwords does. What it does is merely a dictionary lookup for the language that you've specified ('english') and then removes all commonly occurring words like "and", "is" "or" etc. So that we can focus more on the key words and not these prepositions and conjunctions which always occur in plenty.
Note that you might get warnings during any of the steps in this stage, but they're mostly owing to inconsistency in the tweets, and is not a big problem. Remember that you can ignore warnings, but you need to debug your code if you get an error message. When I tried with 500 tweets, I got an error message saying there's some discrepancy in tweet length. Using a smaller sample of tweets, though not advised, is the only way to get past such a roadblock.

Next, we make a Term Document Matrix with the processed tweetCorpus using the ... umm.. TermDocumentMatrix function. This is one helluva function that integrates all your data into a nice understandable format. You might get a warning again, like the one in the screenshot, but worry not.
With this TDM, we now coerce it into a matrix format with the as.matrix function. Once this is done, click on tdMatrix in your workplace (where you have the list of variables), and you'll see how beautifully organised the whole matrix is. You'll notice that it's a sparse matrix with mostly 0s in its cells. A 1 or a 2 in a cell means that that particular term (corresponding to the row of the matrix) occurs once or twice in the tweet corresponding to the column number. It is thus, essentially a term-frequency matrix. Also you can type tweetTDM in the console to see some facts about your tweet document matrix - number of 0s, how sparse the matrix is and so on.
With the last function in this screenshot, we do two things. One, sum each row to get the frequency of each term in ALL tweets combined, and then sort this matrix in decreasing order of frequency.

Now all that is left is to use two more nice functions to plot the cool word cloud. Plug in the following two bits of code, the first of which defines how the cloud is to be formed and the next, which actually displays the cloud :

And presto! You'll see your cloud to the right of your console, under the "plot" tab.
For me, it looked like this:

Repeating the same steps for Mumbai gave the following, more cheerful result.


Comments